Plus how to play the Russell 2000 right now
Getty Images
The S&P 500 index pushed above the 4600 level, which is significant. While market internals have not exactly been rousing as this rally continues, they have not been negative, either.
The 4600 level was a double resistance area from February (see horizontal line on the accompanying chart). On March 29, the S&P 500 gapped up over that level in a show of strength, but it was not able to continue that the next day.
Even so, the moving averages and the “modified Bollinger Bands” (mBB) are now trending higher, and that is a sign that the SPX chart has turned bullish, at least for now. The next resistance level is 4700, and then at the all-time highs at 4800.
Lawrence McMillan
SPX also touched the +4σ mBB, and that completes the McMillan Volatility Band (MVB) buy that was issued in late January. If SPX pushes higher, it might set up a new sell signal, but for now there is not an MVB signal in play.
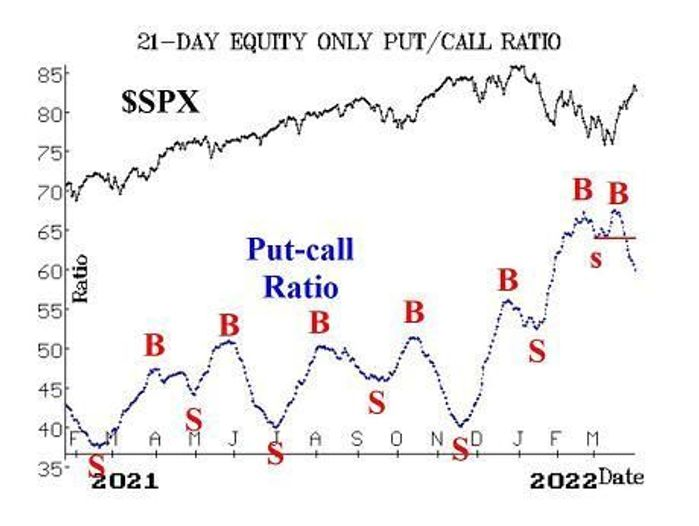
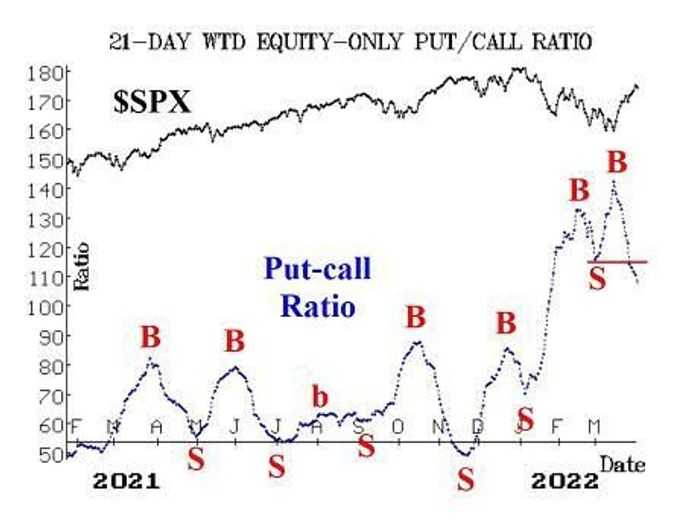
Equity-only put-call ratios are one of our most bullish indicators at this time, as these ratios continue to fall sharply. They have fallen below their February lows, which is bullish confirmation.
There is a lot of room between their current position on their charts and the chart lows, which is where sell signals would normally take place. That is, the bulls have a lot of room to roam with this buy signal.
Market breadth has been a laggard, though. That is not going to come as a surprise to anyone who has been paying attention to market internals over the last year or so. Breadth has struggled to keep pace for a long time.
This past week, the only strong breadth day was March 29, when SPX gapped up over 4600. Still, the breadth oscillators remain on buy signals at this time. If SPX does move higher from here, we need to see breadth expand, lest we end up with a negative divergence such as we had for the last six months of 2021, which led to the correction that ensued at the beginning of 2022.
New 52-week highs have finally eked out a gain over new 52-week lows. This has resulted in a buy signal from the NYSE data for this indicator. “Stocks only” and NASDAQ data have improved, too. At this point, the buy signal is tenuous, but it’s the first one this year for new highs vs. new lows.
VIX indicators have turned more positive as well. Technically, the VIX “spike peak” buy signal of late February has “expired” (the trading system we built around peaks on the VIX chart calls for holding the position for 22 trading days, and that time has elapsed). But it was a successful signal, and one can still retain positions based on it, as long as stops are tightened and long call strikes are rolled higher.
The trend of VIX is no longer bearish (that is, VIX is no longer in an uptrend), since VIX has closed below its 200-day moving average. However, that only removes the intermediate-term sell signal; it is not a buy signal. The VIX 20-day MA would have to cross below the 200-day MA in order for an intermediate-term buy signal to be generated.
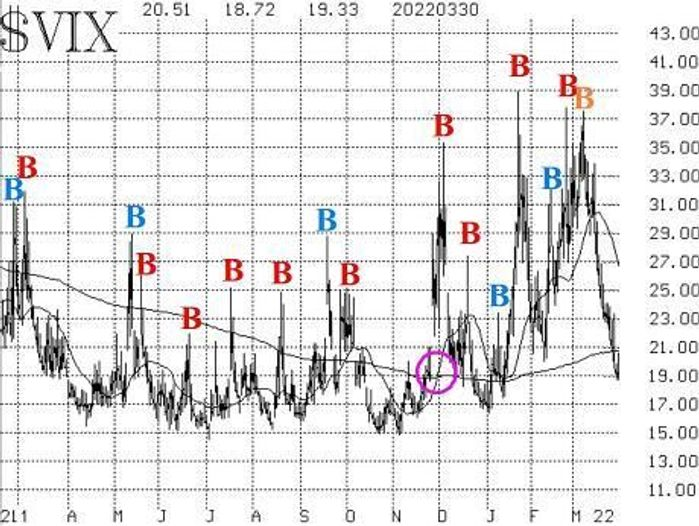
The last time that both VIX and its 20-day MA were below the 200-day MA was late last November (note the circle on the accompanying VIX chart). In early January, VIX crossed below the 200-day MA (similar to what has just happened now), but the 20-day did not, and eventually that led to trouble for the markets a couple of weeks later when VIX began to rise again. So stay alert.
The construct of volatility derivatives remains in a modestly bullish state for stocks. The term structure of the VIX futures slopes upward in the front end, and the VIX futures are trading at healthy premiums to VIX. Also, the Cboe Volatility Index term structure slopes upward.
In summary, there are no sell signals among our indicators at this time, and there are quite a few buy signals, the strongest being the equity-only put-call ratio. We are waiting for some of the “neutral” indicators to generate signals, but that could take some time to develop.
So we are no longer carrying a “core” bearish position, and we are trading our shorter-term signals from the other indicators accordingly. Continue to tighten stops and roll call strikes higher as this rally proceeds.
New recommendation: Russell 2000 ETF
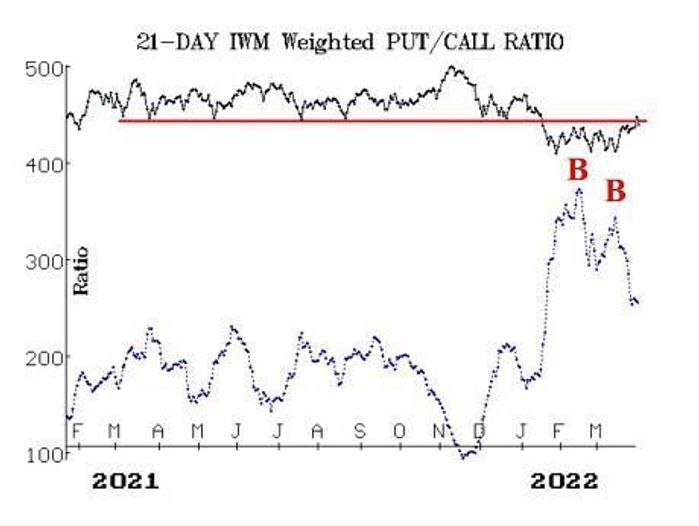
The Russell 2000 was under extreme pressure for most of the first three months of this year. But now it appears to be recovering. There was a long support line at 209 last year, and then when that was broken on the downside this year, it became resistance. The Russell 2000 ETF is challenging that resistance now, and there are put-call ratio buy signals on the Index as well. IWM closed above 209 on March 29 but fell back below it on March 30.
IF IWM closes above 209,
THEN buy 2 IWM Apr (22nd) 210 calls.
IWM: 207.59
Stop yourself out on a close below 204.
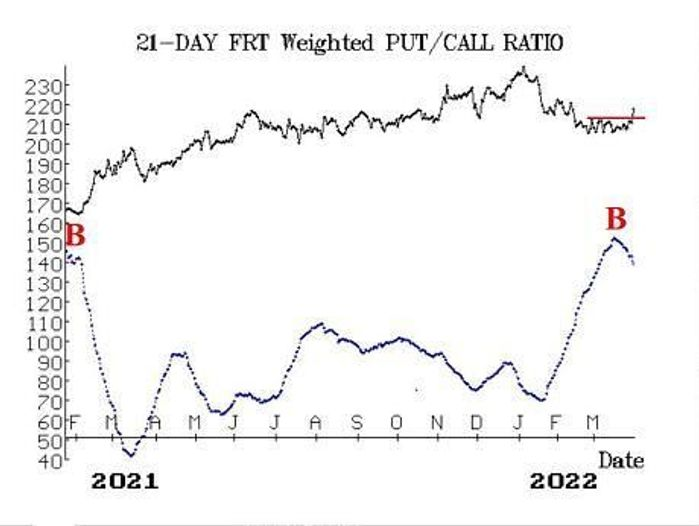
New recommendation: Federal Realty Investment Trust
There is a high-level put-call ratio buy signal in Federal Realty Investment Trust. One from a similar level about a year worked out well.
Buy 2 FRT May (20th) 125 calls at a price of 4.00 or less.
We will hold as long as the put-call ratio remains on a buy signal.
Follow-up action
All stops are mental closing stops unless otherwise noted.
We are going to implement a “standard” rolling procedure for our SPY spreads: in any vertical bull or bear spread, if the underlying hits the short strike, then roll the entire spread. That would be roll up in the case of a call bull spread, or roll down in the case of a bear put spread. Stay in the same expiration, and keep the distance between the strikes the same unless otherwise instructed.
Long 700 FTK: Flotek Industries was stopped out on March 28, when it closed below 1.40.
Long 0 SPY Apr (14th) 460 call and short 0 SPY Apr (14th) 472 call: This position was taken in line with the MVB buy signal. It was rolled up this past week, when SPY traded at the higher strike in the spread, 460on March 29. It turns out that SPX touched the +4σ Band on March 29, so this position should be closed.
Long FUN Apr (14th) 60 calls:We will hold without a stop as these takeover rumors play out.
Long 0 SPY April (14th) 420 put and short 0 SPY April (14th) 390 put, plus also long 0 SPY Apr (14th) 440 put and short 0 SPY April (14th) 410 put:This was our “core” bearish position. It was stopped out when SPX closed above 460 on March 29.
Long 1 SPY Apr (14th) 452 call and short 1 SPY Apr (14th) 467 call:A call bull spread was bought on Feb. 24, in line with the VIX “spike peak” buy signal that occurred that day, and that has since been rolled up. It was rolled up again this week, when SPX traded at 452 on March 25. Stop yourself out if VIX returns to “spiking mode”—that is, if VIX closes at least 3.00 points over any one-, two- or three-day period.
Long 2 ZEN April (14th) 125 calls and short 2 April (14th) 140 calls:Hold without a stop while the activist activity is in progress.
Long 2 BBBY April (8th) 21 calls:Stop yourself out on a close below 18.
Long 2 ORCL May (20th) 77.5 calls:We bought these near the close of trading on March 15, when Oracle closed above 78. We will hold as long as the put-call ratio buy signal is in effect, which it still is. Since the stock is rising, roll up to the May (20th) 82.5 calls for a credit of 3.50 or more.
Long 2 KSS Apr (14th) 62.5: Hold while takeover rumors play out.
Long 5 PSO Apr (14th) 10 calls:Pearson rejected a highly conditional bid from Apollo, and now Apollo has said it won’t bid at all. The stock has lost some ground, and even though Apollo may well return as a buyer in the future, we are recommending selling these calls now to close the position.
Long 3 NLSN May (20th) 22 calls: Nielsen accepted a $28 cash buyout offer. Sell the calls now and be sure to get at least parity for them.
Comments