And this has lead to concerns over input costs… and inflation.
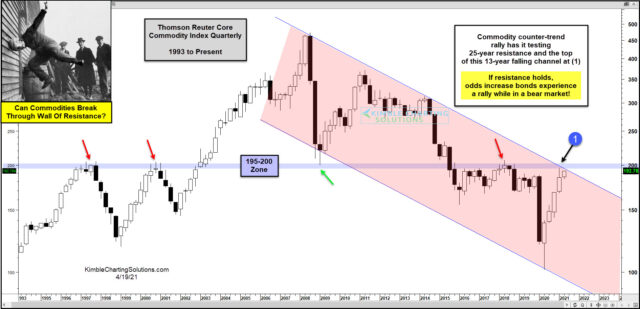
That’s where today’s chart comes into play. It is a 25+ year “quarterly” chart of the Thomson Reuters Core Commodity Index.
As you can see, commodities have been in a broad downtrend channel since peaking in 2007-2008. As well, the 25-year stretch has produced an important support/resistance pivot line (marked by red & green arrows).
So why does this matter to the Commodity Index and several select commodities showing strength?
Because the current 5-quarter rally in commodities is testing this important pivot (now resistance). And at the same time, it is testing the top of its 13-year falling price channel at (1).
If resistance holds, inflation may be held in check and bonds may experience a bear market rally. But if commodities breakout, then inflation concerns will continue to rise, and select commodities showing relative strength will continue higher. Stay tuned!
Comments