TradingKey - Meta Platforms (NASDAQ: META) is trading at around $595 on Monday, August 3, after opening at $593.25. The trading session showed a range between $582.22 - $599.97. The stock closed at $556.71 after a 3.28% gain on July 31 and is up almost 14% from the $521.48 double-bottom low following the earnings report. The first resistance level at $577.38 has been surpassed. Concerning META, Wall Street has broadly stated to buy the dip. 62 analysts are stating META is a Strong Buy, Cathie Wood purchased $14.3 million of stock after the selloff and there is a price target of $700 from an analyst. The main concern still stands at the massive quarterly capex of $31.1 billion fueling the -$784 million in free cash flow. Expect the 50-day EMA at $607 for the next significant resistance.
The Selloff and What Caused It
On July 29, Meta's stock dropped 9.64% in after-hours trading, despite the company beating Q2 2026 revenue estimates (at $60.8 billion, a 28% year-over-year increase). The selloff was attributed to a 13.8% miss in EPS ($6.18 reported versus $7.17 expected), free cash flow which plummeted to $784 million (an $8.5 billion reduction year over year), and increasing full-year capex guidance to a range of $130 to $145 billion.
Like Alphabet, Meta was criticized for increasing capex without justification for new demand, especially when compared to Microsoft’s strong $678 billion backlog. Meta’s stock bounced from $521, narrowly avoiding a record 11-day losing streak. Needham’s Laura Martin said the stock rightfully fell, as Meta’s spending is at Amazon levels (without a cash engine like AWS).
Meta’s core ad business is strong, as evidenced by 3.6 billion daily active users and growth in ad impressions (14%) and prices (12%), as well as 2 billion daily active users on Instagram and 500 million monthly active users on Threads.
Why Wall Street Is Still Bullish
Wall Street is optimistic, as 62 analysts rated META a Strong Buy, Cathie Wood’s ARK fund bought $14.3 million in shares on July 31, and one analyst has a $700 price target. The bull case has three main tenets.
First, if H2 2026 capex levels out, operating leverage from the robust ad business is expected to mechanically restore free cash flow. Second, future projects like the $14 billion El Paso data center (with financing from BlackRock, which owns 80% of the project) and a $10 billion contract with Anthropic could transform Meta’s capital expenditures from a purchase to operating leases.
Finally, the post-earnings drop to $520.26 set a zero valuation for Meta’s AI infrastructure, indicating that the selloff was an overreaction.
What $615 Requires
The $615.32 resistance level is found at $629.26 along the 100-day EMA. Gaining $615 from $595 is approximately 3.4%, and is entirely possible during a week of strong tech sector performance following Amazon's confirmation of AI demand through 2028, along with the ISM and NFP data scheduled for this week.
There are a couple of factors that could make this move likely. The first one is that we see some confirmation from the market that Meta's Anthropic compute deal or some other BlackRock-style arrangements are in place and could reduce the net capex burden.
The second thing that could be likely is if we see one of these Enterprise AI customers get announced and we see that as a form of monetization of AIP along the lines of what Microsoft did with a 30 million seat deployment of Copilot, or if we see a new macro event where we see a strong NFP miss, which will increase the Fed's cut expectations. This will decrease the discount rate and likely improve Meta's future free cash flow status.
META Technical Setup
META's double bottom pattern is reflected at the $521.48 post-earnings low and the base of the chart pattern, which suggests that the formation holds while META stays above $521. The $577.38 resistance level has been surpassed, and the current range of META expands to $599.97.
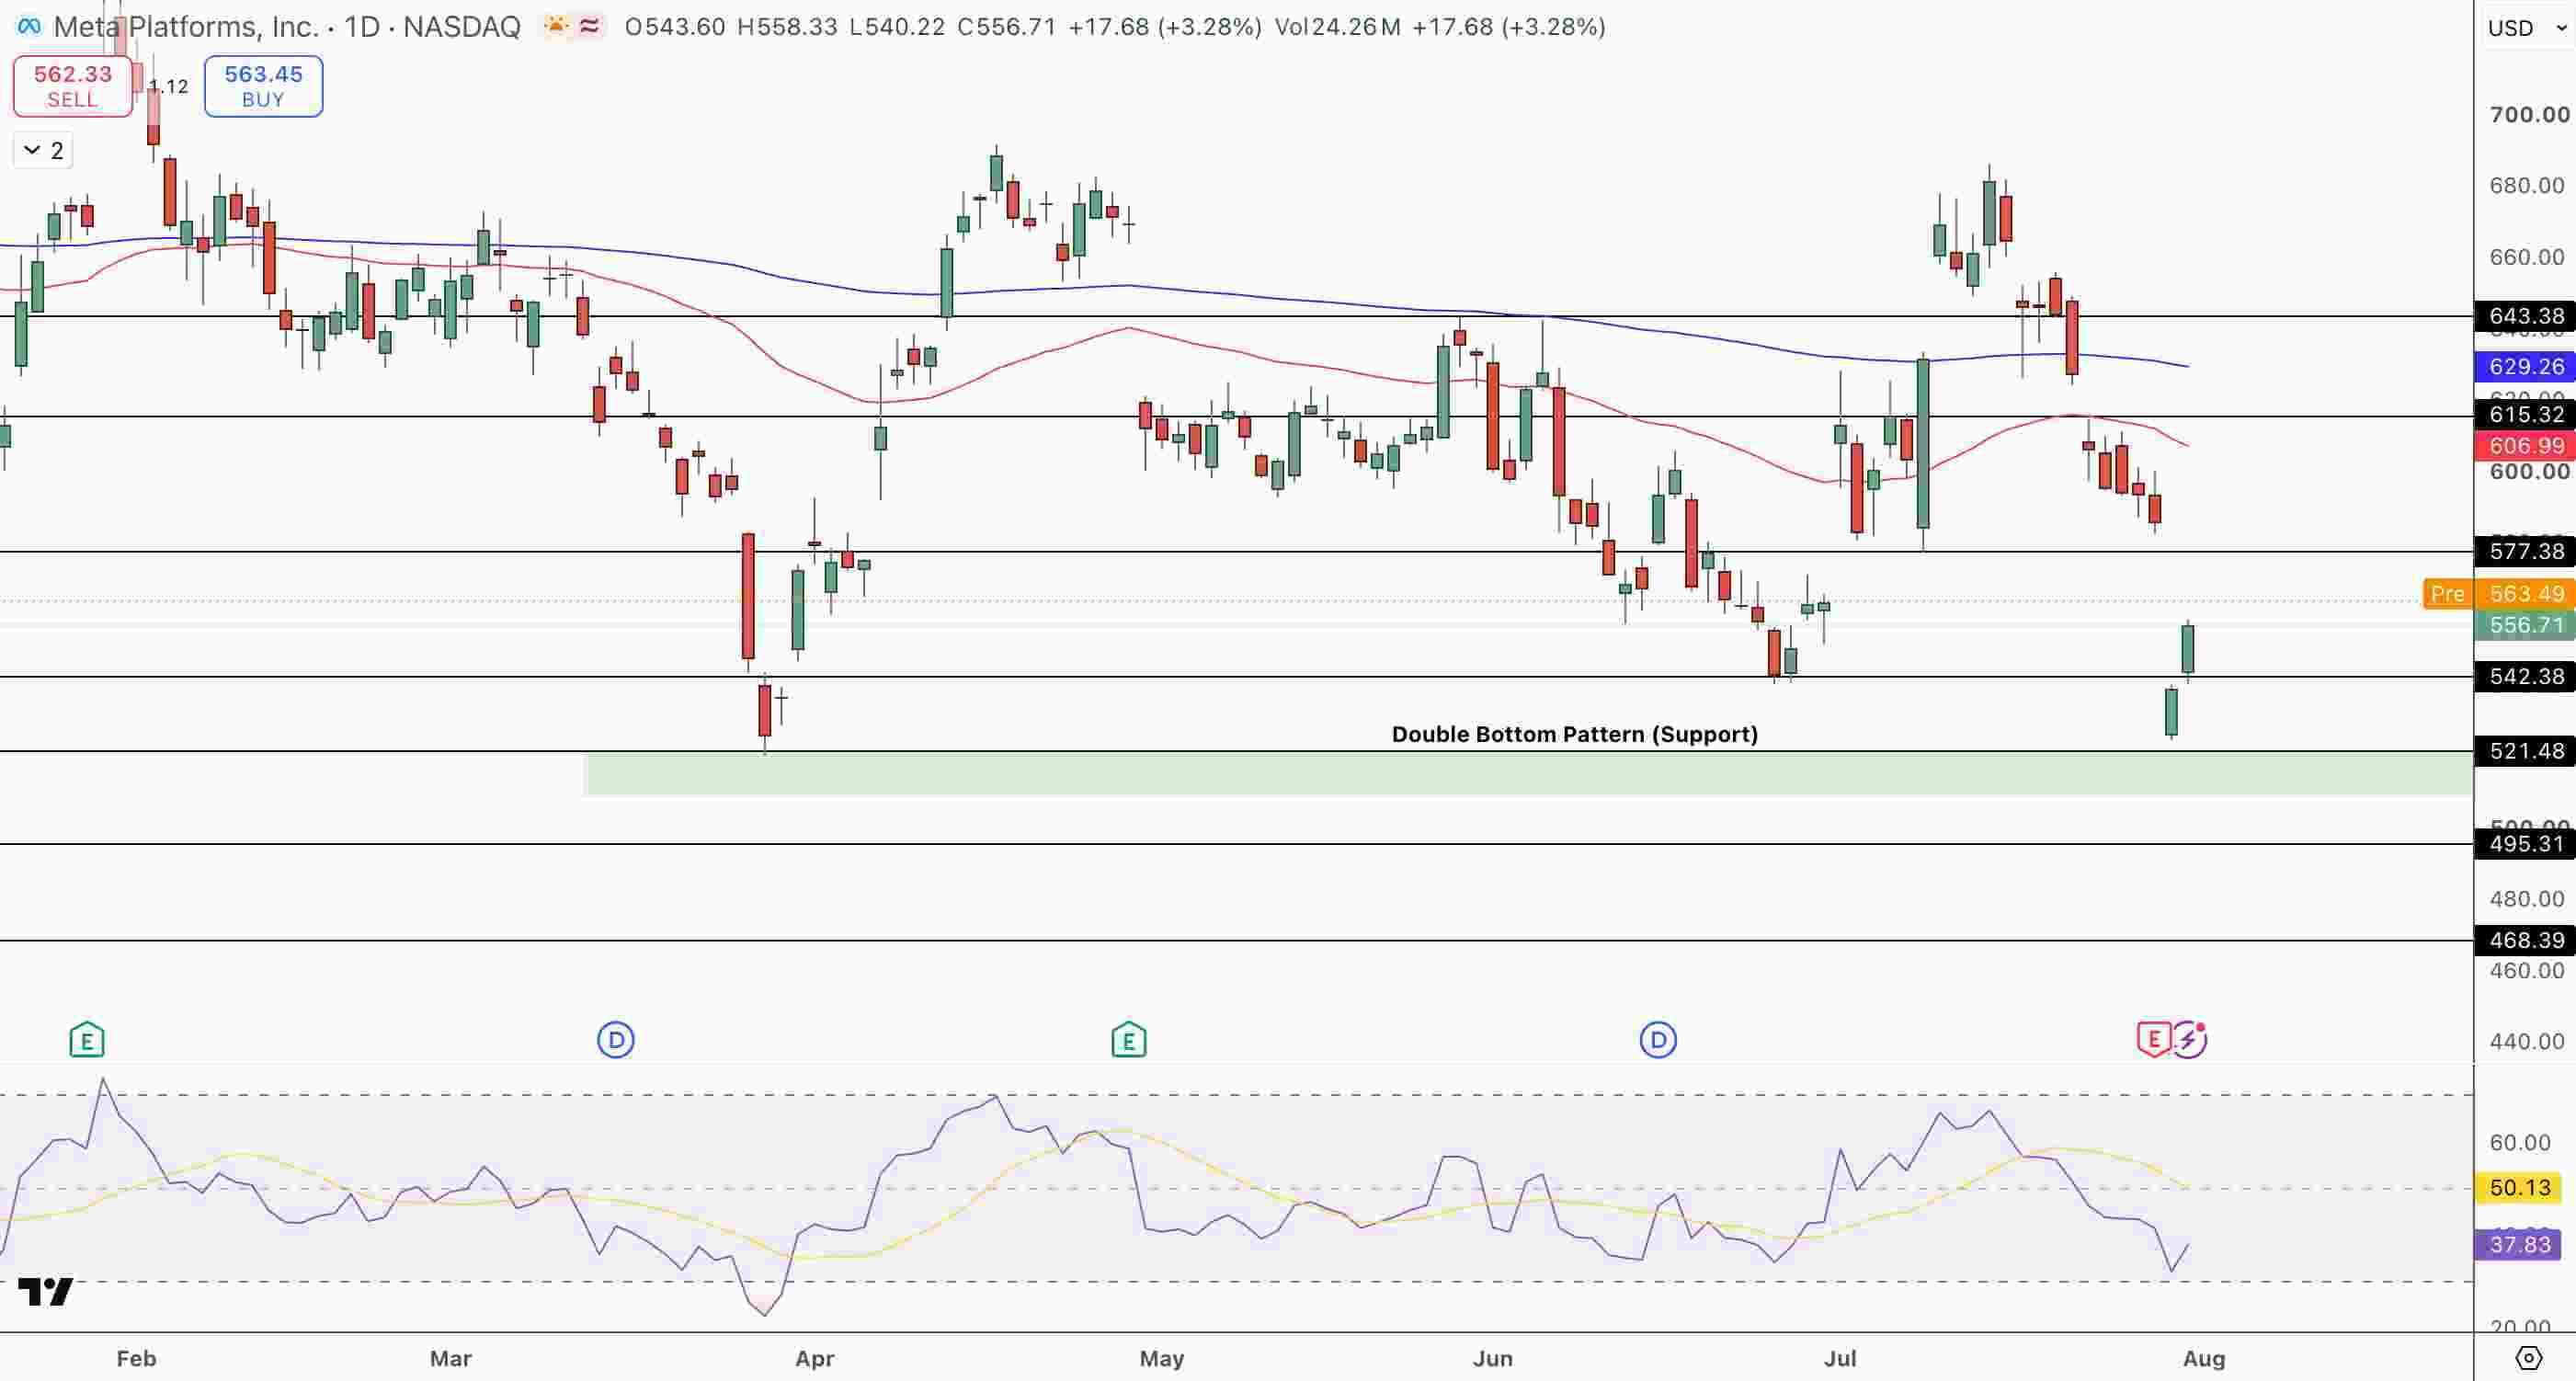
Meta (META) Price Price Chart - Source: Tradingview
The RSI has improved from the post-earnings low of 16 to the range of 45-50, and is neither in the oversold nor overbought condition. From the current position, the immediate key level of interest is the 50-day EMA, which is at $607.
The level above that is $615.32, and the level of interest for the longer-term is $629.26 (100-day EMA). If $577.38 is broken, the next key level would be $542.38, and below that the $521.48 level, which is the double-bottom base, would be tested.
Key Levels
- Today's Range: $582.22 to $599.97; Open $593.25; July 31 close $556.71 (+3.28%)
- Post-earnings low: $521.48 double-bottom. RSI was 16 — lowest since 2022, now near 45-50
- Q2 problem: FCF $784M (down from $8.5B YoY). Capex $31.1B with $31.9B operating cash flow. EPS miss 14%
- Q2 positives: Revenue $60.8B (+28%). 3.6B daily actives; 2B daily on Instagram with ad impressions up 14%
- Bull case: Cathie Wood $14.3M buy. 62 analyst Strong Buys, $700 target. BlackRock El Paso deal
- $577 cleared: First resistance was passed today with next at $607 (50-day EMA), $615.32, $629.26 (100-day EMA)
- Support: $577.38, $542.38, $521.48 (double-bottom)
- 52-week range: $520.26 to $796.25; ATH close $787.42 (August 12, 2025)
Was the Post-Earnings Selloff Justified?
Evidence supports both points. Justification for the selloff included 91% FCF dropped to $784 million (from $8.5 billion last year) with $31.1 billion in capex eating near all of the $31.9 billion in operating cash flow. Capex with no demand specifics, an EPS miss of 13.8%, further mandated the selloff. Justification for the bounce was at $521, Meta was trading at 14 times forward operating earnings, with a 28% ad revenue growth, and 3.6 billion daily active users, implying no value for the infrastructure of their AI. Neither justification was correct.
What Would Change the FCF Story?
Three factors could change the FCF story. First, the $14 billion BlackRock El Paso deal and the Anthropic compute leasing example shift direct capex to operating lease costs, improving FCF without a spending reduction. Second, AI revenue from Meta AI, Llama, or cloud computing could occur in the capex spend. Third, maintaining the capex guidance in Q3 would allow markets to estimate the FCF normalization that is currently not included in the analyst models.
Bottom Line
Meta appears to have bottomed at $521 and has moved up to $595, first surpassing the $577.38 level of resistance. The next hurdle is the 50-day EMA at $607. The concern of $784 million in FCF on $31 billion in quarterly capex is valid, however, it could potentially be alleviated by BlackRock-style structures and more AI revenue. 62 Strong Buy ratings, Cathie Wood buying, and $700 price targets all indicate that the market is bullish on Meta. Needham's counter that the pullback was justified is also correct. At $595, the market is pricing a partial Meta recovery from an overreaction to legitimate concerns. The biggest issues that will affect Meta the most will be the NFP data on Friday and the announcement of new capex structures.
Find out more
Comments