$Nvidia (NVDA) $It will announce its third quarter financial report for fiscal year 2026 after the market closes this Wednesday (November 19). The Nvidia earnings report has become one of the most anticipated events on Wall Street due to the snowballing growth in artificial intelligence (AI)-related demand.
The market expects Nvidia's financial performance this quarter: revenue of US $54.8 billion, a year-on-year increase of 56%; Adjusted earnings per share (EPS) of $1.25, up 60% year-over-year; Data center revenue was $48.6 billion, up 58% year-over-year.
Three highlights:
Investors are likely to focus on several issues during earnings and earnings calls:
Blackwell GPU The promotion of:Investors will be watching for the latest developments in Nvidia's Blackwell GB200 GPU production boost. Management's view on whether the company can accelerate production to meet high demand for Blackwell chips will be important-any signs of manufacturing or supply chain constraints could affect investor sentiment.
China Sales:In the second quarter report, Nvidia's guidance for the third quarter assumed no H20 exports to China. Investors will be watching for more information about this, as China sales may drive the company's future growth.
Growth in the automotive and robotics industries: This is an area of the business with significant growth potential, and investors pay attention to its performance. Last quarter, auto revenue was $586 million, up 69% year-over-year.
Options Market Performance
In the past 12 quarters, the options market hasOverestimating NVDA's Post-Earnings Stock Price Volatility 67% of the Time。 The average fluctuation range of forecasts after the financial report is announced is±8.1%, while the actual average fluctuation amplitude (absolute value) is only7.3%。
The current implied volatility of Nvidia in the options market is±7.6%, the stock price changes after the last seven Nvidia financial reports were all less than the implied volatility.
1. Strategy structure
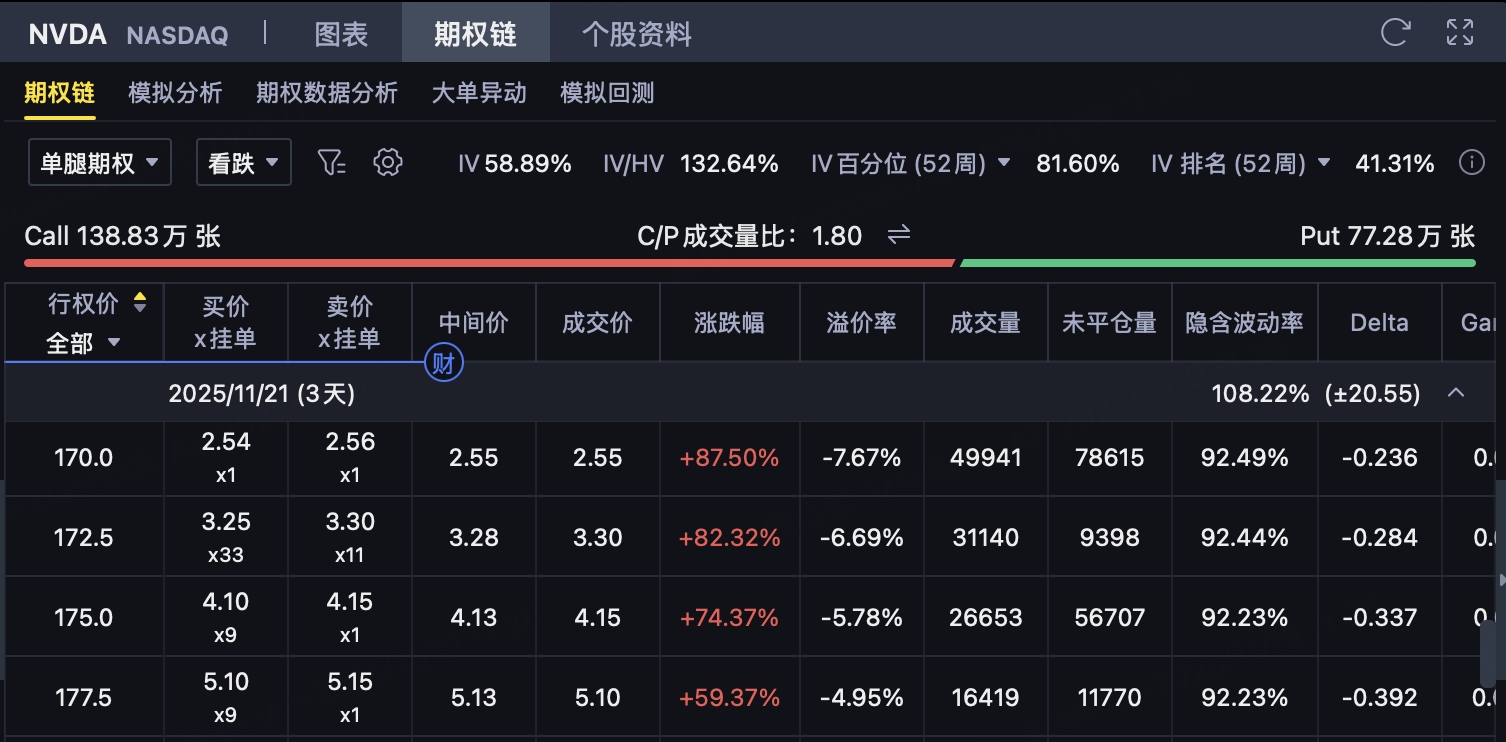
Investors build aBull Put Spread Bull Put Spread, consisting of two put options with the same expiration date:
Sell higher strike price Put: K ₂ = 175, premium revenue $4.15
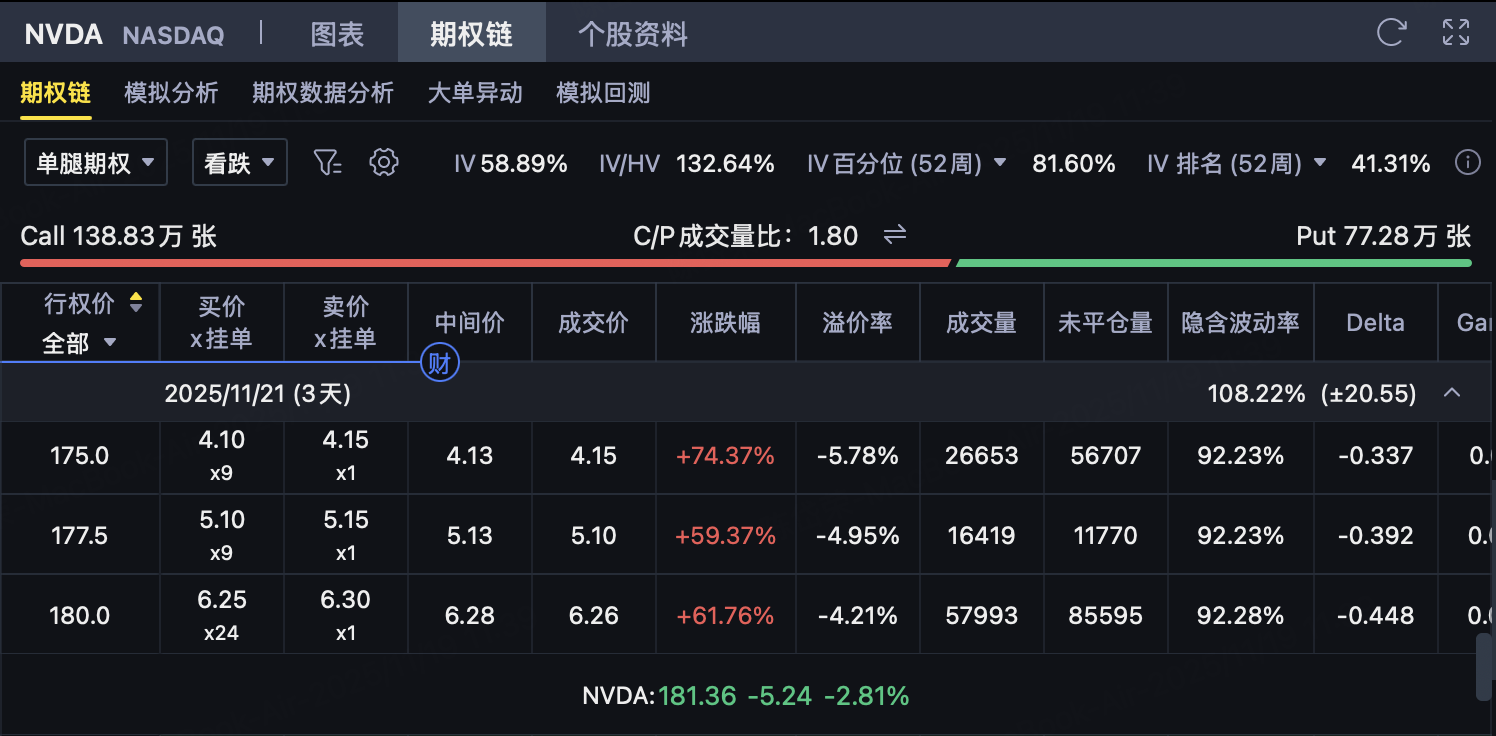
Buy lower strike Put: K ₁ = 170, premium spend $2.55
This is a credit strategy with a bullish bias, limited risk and limited returns. When the underlying price remains at$175 or moreWhen, maximum profit can be achieved.
Initial net income
The net premium received by investors is:
Net premium Income = Selling 175P Income − Buying 170P Expenses = 4.15 − 2.55 =$1.60/Share
The corresponding total income (1 contract = 100 shares) is:
1.60 × 100 =$160/contract
This net income is the maximum potential profit that the strategy can determine when it opens a position.
3. Maximum profit
If the underlying price expires≥ $175, both Put shares are out-of-the-money options and will not be exercised. Investors retain the entire net premium income.
Maximum profit = $1.60/share corresponding to total profit =$160/contract
This situation means that investors' judgment on the underlying being bullish or maintaining stability is completely correct.
4. Maximum loss
If the underlying price expires≤ $170, both Put shares enter the price, and the portfolio bears the maximum loss under the constraint of the full execution spread.
Strike spread
= 175 − 170
= $5
Maximum Loss = Strike Spread − Net Income = 5 − 1.60 =$3.40/Share
Corresponding total loss = 3.40 × 100 =$340/contract
This loss is the worst case scenario of the strategy, which occurs when the underlying price drops significantly.
5. Break-even point
The break-even point for a bull put spread is:
Breakeven = Higher Strike Price − Net Income = 175 − 1.60 =$173.40
Hence:
When the underlying maturity price≥ $173.40When investors make profits
When the underlying maturity price< $173.40When the strategy begins to lose money
The break-even point means that investors have a certain buffer on their bullish expectations for the underlying, and even if it falls to $173.40, they still won't lose money.
6. Risk and return characteristics
Maximum gain: $160/contract
Maximum loss: $340/contract
The profit/loss ratio is approximately: 1: 2.125
Strategy applicable scenario: investors expect the underlying priceStay above $175, or at least not fall below breakeven
Strategy positioning:A Bullish to Neutral credit strategy with limited returns and limited risks
Engage and Win Options Rewards!
Share your thoughts on options trading or the market in the comments below.
10 lucky participants will each receive a free copy of the Options Handbook!
Already have one, you’ll get a USD 5 Options Voucher instead!
The Options Handbook takes you from the fundamentals to advanced strategies, helping you gradually build your own trading system. You’ll also gain insights from 10 top traders, and learn how to avoid common options trading pitfalls — making your decisions clearer.
💬 Don’t miss out, drop your thoughts and win your reward!
Comments