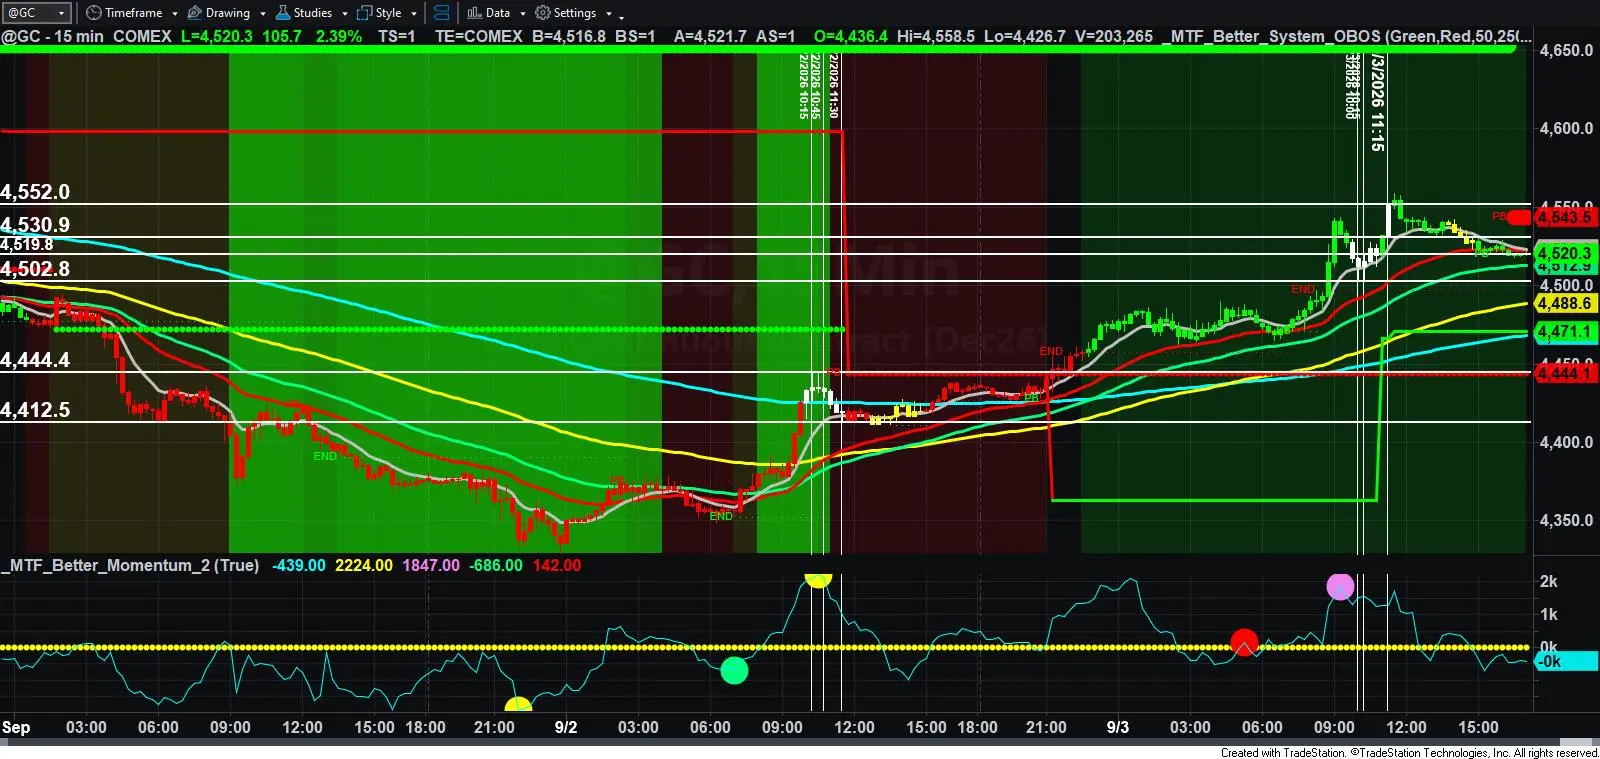
$SPDR S&P 500 ETF Trust(SPY)$ BTC.XGCOn the 15-minute chart, bullish divergence is marked with a green dot, bearish divergence with a red dot, exhaustion with yellow dots, and a flush with a purple dot. Pros show up as white candles, and the 50 EMA is the green line. Above $4519.80, this reads as a buy-the-dip long setup in a tightly coiled tape.
Disclaimer: Investing carries risk. This is not financial advice. The above content should not be regarded as an offer, recommendation, or solicitation on acquiring or disposing of any financial products, any associated discussions, comments, or posts by author or other users should not be considered as such either. It is solely for general information purpose only, which does not consider your own investment objectives, financial situations or needs. TTM assumes no responsibility or warranty for the accuracy and completeness of the information, investors should do their own research and may seek professional advice before investing.
Comments