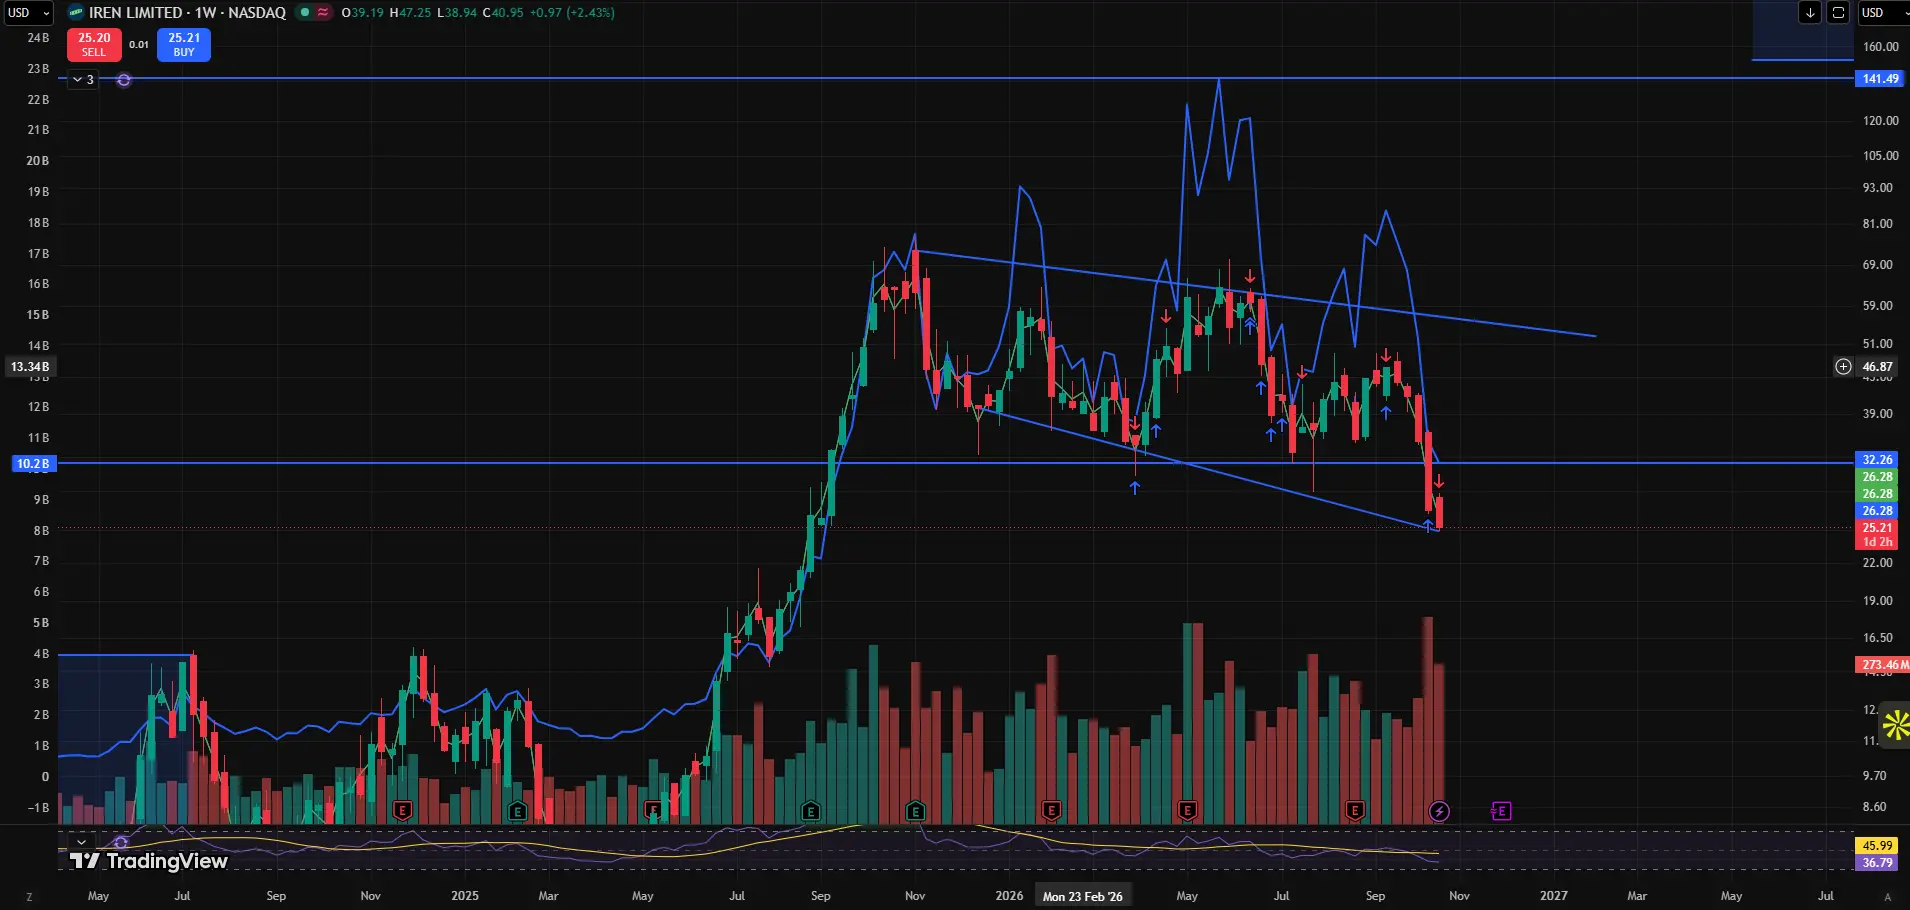
$IREN Ltd(IREN)$ Here is the dilution visualized.
The blue line is market cap. Without dilution, the June peaks could have hit $100+.
The proportions on the chart may be a bit off, but this is just a general representation. You can clearly see where share price was diluted the most — the $50 range. That is why we struggled to break past $49. A huge sell wall from dilution. This is all speculation though.
Current market cap was around $32 a year ago.
I am still bullish long term. I just hope my '28 $50 leaps can recover.
Disclaimer: Investing carries risk. This is not financial advice. The above content should not be regarded as an offer, recommendation, or solicitation on acquiring or disposing of any financial products, any associated discussions, comments, or posts by author or other users should not be considered as such either. It is solely for general information purpose only, which does not consider your own investment objectives, financial situations or needs. TTM assumes no responsibility or warranty for the accuracy and completeness of the information, investors should do their own research and may seek professional advice before investing.
Comments