Is another 500 points droping of market waiting for us?
Last week, U.S. stocks were attacked by multiple negative news and experienced a significant decline. Counting from the top, there has been a three-game weekly losing streak. Although there have been two times of adjustments in the market before, the turn of trading logic seems to be different this time.
From a fundamental point of view, after the latest non-farm data, everyone is no longer concerned about when the Federal Reserve will cut interest rates, but beginning to worry about the U.S. recession with the reference of some forward-looking indicators. On the other hand, the Bank of Japan's rate hike actions are also regarded as an important signal. Coupled with the plunge triggered by Intel's earnings report, it does not look very good. However, a careful comparison shows that among these three variables, only the Bank of Japan may be an effective warning signal.
Regarding the recession, we have always emphasized that the only and widely recognized thing is still the contraction of U.S. GDP for two consecutive quarters. Although there are many historical indicators that can better predict the possible recession, as the Merrill Lynch cycle is no longer valid, historical experience is no longer so valid.
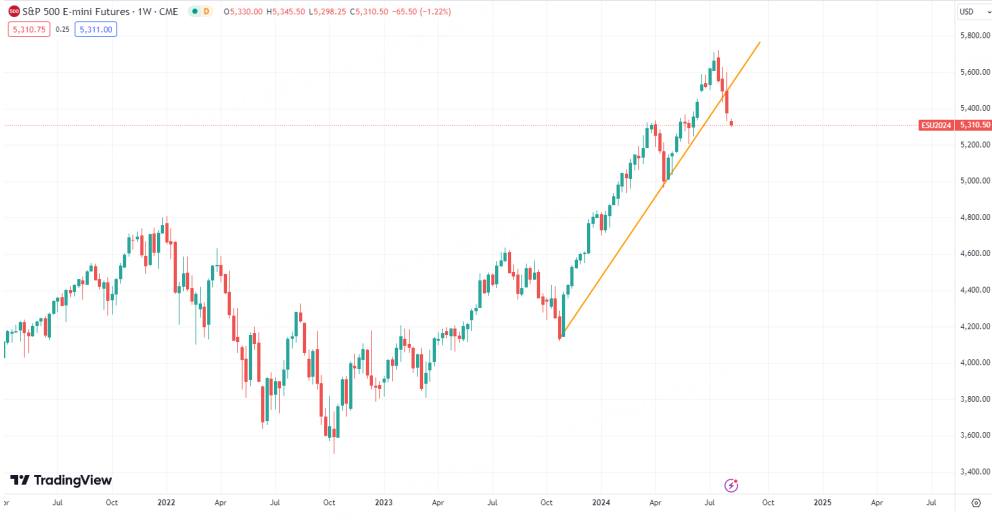
All these are observed from a relatively optimistic perspective, and from the perspective of technical indicators, it is inevitable that August is an adjustment month. Two weeks ago, we talked that if the U.S. stock market does not stabilize and rebound and reach a new high in the current week/next week, it will face more backtests. At present, after the trend line is pierced, it is difficult for the weak situation to suddenly change.
On the bright side,At the monthly level, most of the S&P's corrections from the highest point in the past three years have been around 5%, and the highest one is close to 9%. According to this data, bulls should be able to hold the key weekly support of 4963, thus avoiding obvious technical breakdown.
Of course, we can't completely ignore the possibility of changing the market. Regarding this point, whether the crude oil range we talked about last week will be broken is an observable direction. Another direction to look at is the volatility indicator in the technical indicators. At present, the ATR value of S&P is already at a staged high level. If the subsequent indicator reading starts to fall, but the price remains under pressure, it is a bearish signal.
On the whole, it is unlikely that the market will turn from bull to bear immediately, and we are still optimistic about the market until the end of the year.
$NQ100 Index Main 2409 (NQmain) $$SP500 Index Main 2409 (ESmain) $$Dow Jones Index Main 2409 (YMmain) $$Gold Main 2412 (GCmain) $$WTI Crude Oil Main 2409 (CLmain) $
Disclaimer: Investing carries risk. This is not financial advice. The above content should not be regarded as an offer, recommendation, or solicitation on acquiring or disposing of any financial products, any associated discussions, comments, or posts by author or other users should not be considered as such either. It is solely for general information purpose only, which does not consider your own investment objectives, financial situations or needs. TTM assumes no responsibility or warranty for the accuracy and completeness of the information, investors should do their own research and may seek professional advice before investing.


Gg