Will the pattern of three consecutive weekly declines in U.S. stocks repeat this time?

The US stock market has experienced a continuous decline over the past three weeks, with an overall drop of around 5%. From the perspective of market trends over the past year and a half, this three-week period often marks an important node, indicating either the end of an adjustment or the conclusion of a phase. Therefore, whether the market can stabilize this week will have significant reference value.
Using the S&P 500 as a reference, every adjustment since the middle of last year has lasted about three weeks, followed by a resumption of the upward trend. Even in slightly longer-term market trends with more weekly adjustments, there usually is a small rebound or correction after three weeks. If history repeats itself or if trends need to continue, the US stock market should not experience further declines this week or next. Conversely, more downward movement would not only affect market confidence but also risk prompting more medium- and long-term bulls to withdraw.
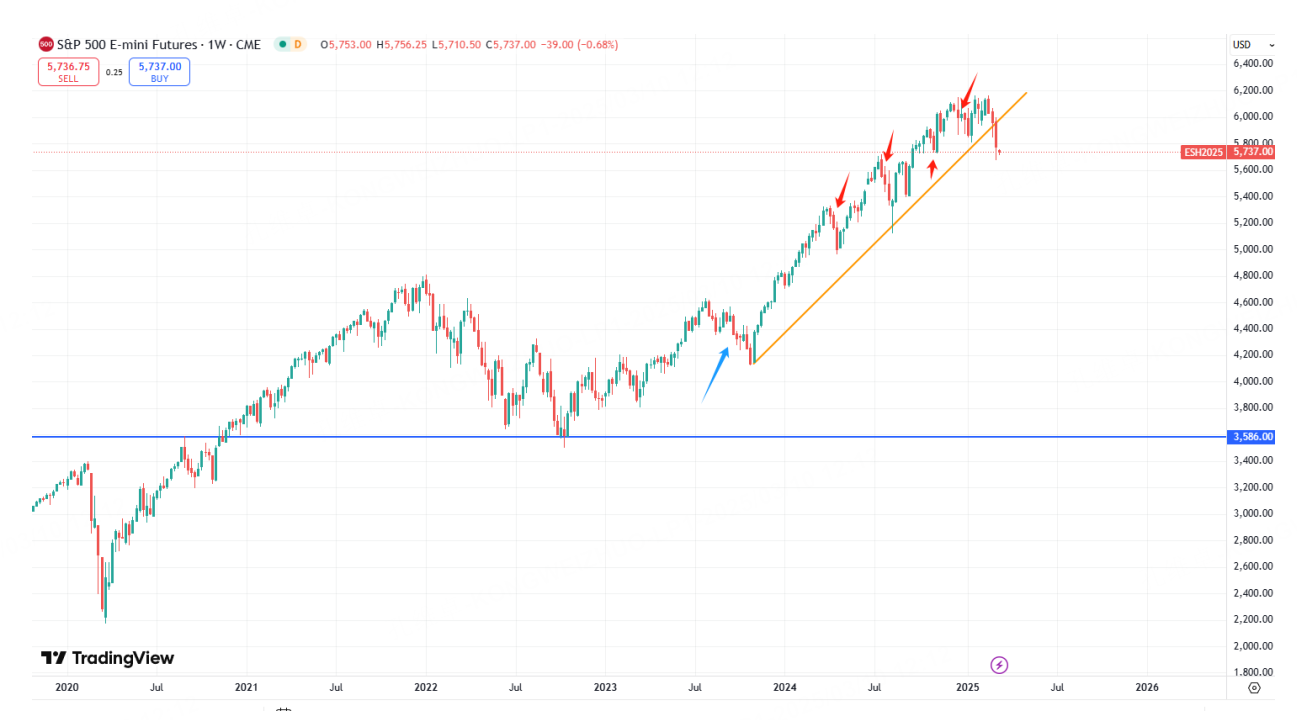
From a technical perspective, last week saw the completion of a full nine signals on the daily chart, but the rebound was limited. Structurally, there is a double top or double head pattern, with theoretical targets for a pullback around 5,500 (the smaller-scale double head target of about 5,935 has already been met). Given the conflicting bullish and bearish signals, a good strategy is for shorts to lock in some profits, and for longs to wait for 1-2 daily reversal signals before considering buying.
Recently, the market has not been short on news, but there have been few fundamentally new topics. Whether it's the Russia-Ukraine issue, tariff hikes, or the Federal Reserve's monetary policy, these seem bearish on the surface but are essentially repetitive. The market's decline stems more from insufficient force in buying at high levels and, to some extent, Donald Trump's intentional or unintentional maneuvers. As key stocks have fallen back to their pre-election rally points, their value has improved. The "fight and withdraw" strategy introduced at the beginning of the year can now remove the "withdraw" aspect, allowing for a gradual search for "fight" opportunities. However, it's worth noting that an adjustment of about 5% is unlikely to be the final target of a true correction. The market will likely undergo more fluctuations with opportunities for profit.
In terms of reference indicators, the recent movements in USD/JPY and oil prices have also been signals of pressure on risk assets. It is relatively important whether oil can hold the critical low of $63.6. Currently, concerns about low oil prices potentially triggering prisoner's dilemma risks could push prices down from both news and technical perspectives. Historically, oil prices have been positively correlated with stock market performance, tied to economic prospects, so a collapse in oil prices would not help the stock market stabilize. As for USD/JPY, it would need to fall below 139 to clearly indicate a risk-off mode; if such a decline occurs, risk assets would likely not be worth holding.
Overall, based on historical patterns, the US stock market should experience a corrective rebound this week or next. Therefore, shorts can consider temporarily covering positions and waiting for higher prices after the rebound. Longs need to observe reference indicators and the performance of stock indices over time. If the three-week weekly adjustment pattern fails, they should be wary of the risk of larger-scale pullbacks.
$E-mini Nasdaq 100 - main 2503(NQmain)$ $E-mini Dow Jones - main 2503(YMmain)$ $E-mini S&P 500 - main 2503(ESmain)$ $Gold - main 2504(GCmain)$ $WTI Crude Oil - main 2504(CLmain)$
Disclaimer: Investing carries risk. This is not financial advice. The above content should not be regarded as an offer, recommendation, or solicitation on acquiring or disposing of any financial products, any associated discussions, comments, or posts by author or other users should not be considered as such either. It is solely for general information purpose only, which does not consider your own investment objectives, financial situations or needs. TTM assumes no responsibility or warranty for the accuracy and completeness of the information, investors should do their own research and may seek professional advice before investing.
- ARod·03-12good analysis and infoLikeReport
- popzi·03-12Interesting analysisLikeReport
- Ryan_Z0528·03-12thanks for sharing!LikeReport
- happyli·03-12Possible reboundLikeReport
- LleyZ·03-13NiceLikeReport
