On Dec.26, U.S. stocks are often "still celebrating the holidays"
Judging from historical data, the US stock market$S&P 500 (. SPX) $It usually shows a relatively strong performance on December 26th of each year.According to the analysis of long-term historical data by market statistics agencies (such as Bespoke Investment Group), with the normal market opening on December 26, the S&P 500 index has only fallen in a very few years (about 6 times) in the past 39 years or so, and has never recorded a one-day decline of more than-0.5%. Relevant data show that the average increase of this trading day is about +0.5%, and the median increase is about +0.4%, which ranks among the top among all trading days in the whole year, showing a high probability of rise and a relatively stable positive return characteristics.
However, although the long-term statistical results are positive, the actual trend of individual years may still vary. For example, on December 26, 2024, against the background of relatively light post-holiday trading volume, the S&P 500 index opened slightly lower (about-0.25%), and the trend throughout the day was dominated by narrow fluctuations, reflecting the post-holiday market The impact of insufficient liquidity on short-term performance. Market participants generally point out that trading days after holidays tend to have low trading volume, and their volatility and statistical significance are usually weaker than regular trading days.
From a seasonal perspective, December 26th is usually regarded as part of the "Santa Claus Rally". This market generally refers to the last five trading days after Christmas and the first two trading days of the next year. Historically, U.S. stocks as a whole are more likely to show an upward trend at this stage. However, it should be noted that if December 26th coincides with the weekend or the exchange is closed, no relevant trading data will be generated that year, and the historical statistical law does not mean that future performance is inevitable. Overall, long-term data shows that December 26 is one of the trading days with a higher winning rate for the S&P 500 index throughout the year, but the short-term trend still needs to be comprehensively judged based on the macro environment, liquidity conditions and market sentiment of that year.
1. Strategy structure
Investors in$S&P 500 (. SPX) $Create aBull Put Spread Bull Put Spread, consisting of two Put options with the same expiration date:
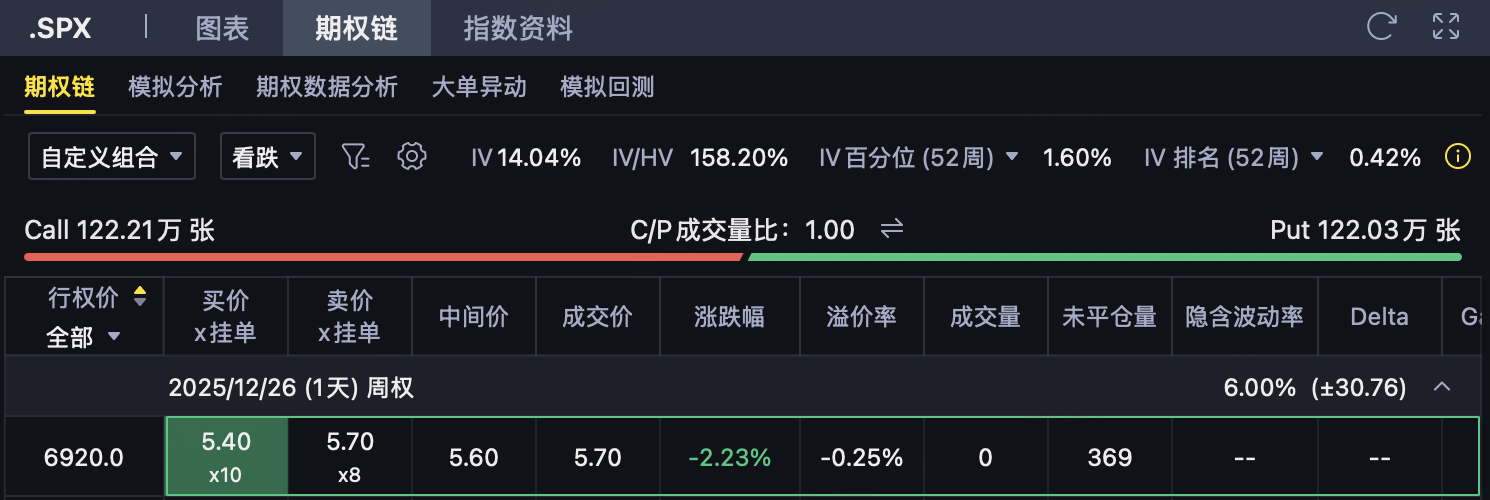
Sell higher strike pricePut: Strike price K ₂ = 6920, premium received US $5.7 (higher strike price, higher premium, is the main source of income)
Buy Lower Strike Price Put: Strike price K ₁ = 6915, paying premium $4.5 (used to limit maximum losses when the index falls sharply)
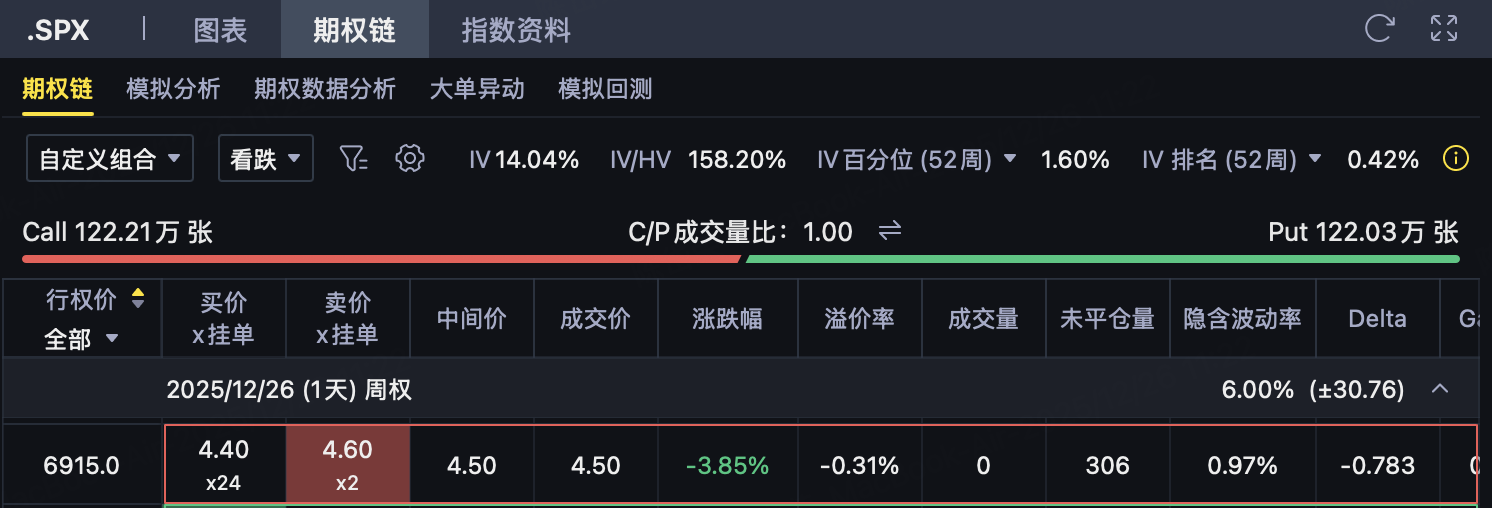
The combination isCredit type, moreSpread strategy. Investors expect SPX at expirationMaintain around or above 6920 points, even if it falls slightly, as long as it does not fall below the key range, it can still make a profit.
Initial net income
Net premium (per point)
= 5.7 − 4.5
= $1.2
The SPX option multiplier is 100, so: Total net income = 1.2 × 100 =$120/contract
This is what investors can lock in when opening a positionMaximum potential profit。
3. Maximum profit
The maximum profit is equal to the net premium initially received:Maximum profit = $120/contract
The occurrence condition is: When the SPX expiration price≥ 6920 pointsAt that time, both Put shares were out-of-the-money and returned to zero, and investors retained all premium.
4. Maximum loss
The biggest loss occurred when the SPX dropped sharply and fell below the lower strike price:
Strike spread
= 6920 − 6915
= 5 points
Maximum loss (per pip)
= 5 − 1.2
= $3.8
Total maximum loss = 3.8 × 100 =$380/contract
The occurrence condition is: When the SPX expiration price≤ 6915 points, the spread is fully triggered, and the loss reaches the upper limit.
5. Break-even point
Breakeven Point (BEP) = Higher Strike Price − Net Income = 6920 − 1.2 =6918.8 points
Maturity judgment rules:
SPX ≤ 6918.8 → Investor losses
SPX = 6918.8 → flat
SPX ≥ 6918. 8 → Earnings for Investors
6. Risk and return characteristics
Maximum gain: $120/contract (limited)
Maximum loss: $380/contract (limited)
Profit and loss ratio: 120: 380 ≈1: 3.2
Applicable scenario: Investors judge SPXIt will not significantly fall below 6920 points, more inclined to fluctuate at a high level or moderate upward trend, hoping to obtain stable premium returns through time value decay, while strictly controlling downside risks.
Disclaimer: Investing carries risk. This is not financial advice. The above content should not be regarded as an offer, recommendation, or solicitation on acquiring or disposing of any financial products, any associated discussions, comments, or posts by author or other users should not be considered as such either. It is solely for general information purpose only, which does not consider your own investment objectives, financial situations or needs. TTM assumes no responsibility or warranty for the accuracy and completeness of the information, investors should do their own research and may seek professional advice before investing.
