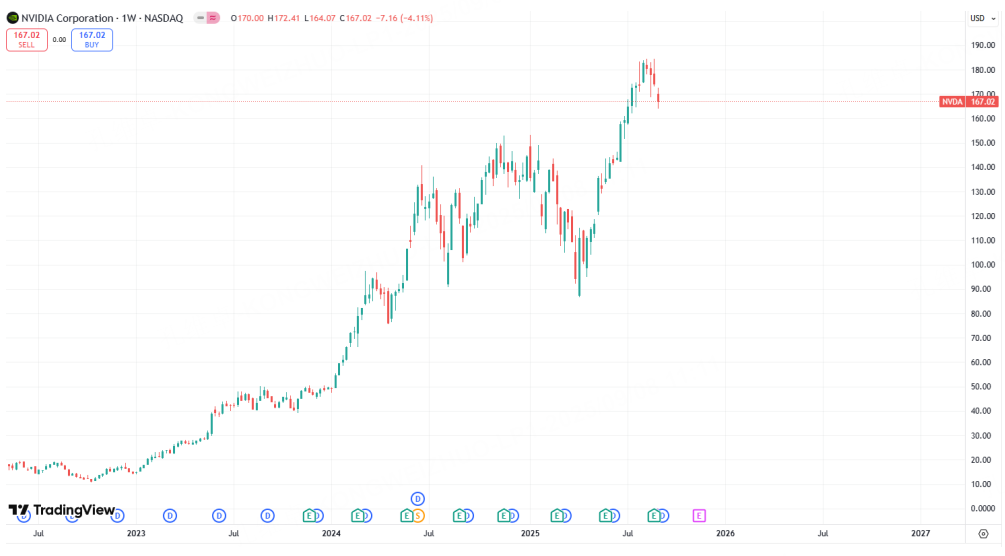
Over the past two weeks, the performance of major U.S. stock indices has diverged, with the Nasdaq showing relative weakness. Nvidia, a key bellwether for the U.S. market, has been in a steady pullback, breaking below its recent weekly swing lows. Following Trump’s return to the political stage, Nvidia’s performance holds significant leading indicator value. It is reasonable to suspect that the divergence between individual stocks and the broader market will not persist for long. Either the current strength in the indices faces a risk of a catch-up decline, or new news will emerge to help Nvidia recover lost ground quickly.
On the news front, there is no obvious negative catalyst for Nvidia. Its earnings report met expectations and has been interpreted as a “profit-taking event,” but fundamentally, the impact is limited. However, the price action tells a different story. Once the support near 168 was broken, the short-term technical outlook has shifted slightly in favor of bears. It’s especially important to note that last month’s monthly candlestick was a high-level doji with a prominent upper shadow, signaling significant short-term selling pressure.
Until there is definitive news on two major variables—U.S.-China relations and Trump’s health—risk assets are unlikely to experience a sharp reversal. However, it is quite normal to see corrections and adjustments during an uptrend. If we use the previous key highs as a reference, Nvidia could potentially face an additional 10% downside. If this assumption holds, the major indices cannot maintain their current high-level consolidation and are also due for a correction.
Using the S&P 500 as a reference, the recent breakdown of the wedge pattern basically confirms that a correction is coming. The theoretical correction targets are around 6239 and 6157, with the latter level also representing a prior peak. We can also monitor the daily volatility indicator, ATR, to gauge the extent of a possible correction. After high volatility in April, index volatility has steadily declined, and the 14-day ATR currently stands near 63, which is considered a relatively low level historically.
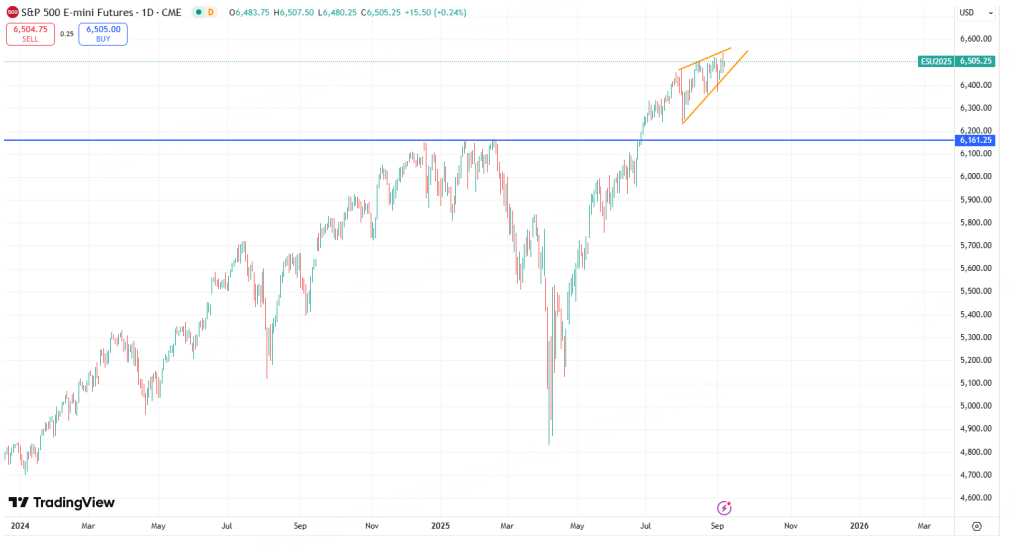
To align with a downward move, volatility would need to rise back above 70, or even 85, to properly match a decline signal. These signals often intertwine and do not have a fixed sequence of occurrence.
From a short-to-medium term strategy perspective, investors might consider buying out-of-the-money put options on the index to speculate on a potential catch-up correction. It is also possible to explore hedging opportunities between indices—for instance, going long on the S&P and short on the Nasdaq before a downturn, then reversing positions after the weakness unfolds. However, these strategies depend heavily on timing decisions. More conservative traders may prefer to wait patiently for individual stocks and indices to reach correction targets before looking to buy low in line with the trend. Unless new information emerges on the two aforementioned key variables, the current bullish sentiment could persist through year-end or early next year.
The recent Federal Reserve rate cut, whether perceived as positive or negative, is a relatively minor influence unlikely to change the overall market trend. In the longer term, considering global economic trajectories and Trump’s unconventional approach, the risk of a historically significant market event during his term remains. But that is a concern for the future; for now, there is still time and space to prepare, and any such risk warnings will be communicated promptly.
$E-mini Nasdaq 100 - main 2509(NQmain)$ $E-mini S&P 500 - main 2509(ESmain)$ $E-mini Dow Jones - main 2509(YMmain)$ $Gold - main 2512(GCmain)$ $WTI Crude Oil - main 2510(CLmain)$
Comments