Flash Crash in Silver: Is It Time to Pivot Your Strategy?
Silver experienced a significant drop last night. The sell-off erupted just after the CME raised margin requirements for silver futures. This move by the world's largest exchange by trading volume seems like an official endorsement of the view that "silver is currently overbought." Following the sudden liquidity tightening, silver futures fell over 10 points, causing a minor pullback in the US stock market's Christmas rally. Many are concerned: Is the uptrend in silver over? How likely is a continued sharp decline? Could it end the US stock market's Christmas rally as well?
In fact, we warned about a potential silver drop in our previous analysis. I specifically highlighted the importance of the 5-day moving average for the main continuous silver futures contract. Theoretically, a short squeeze rally often uses the 5-day MA as a dividing line. Above it, we can remain bullish on silver; a break below it typically signals the short squeeze phase is likely over.
At that time, I advised on how to adjust our strategy if silver broke below the 5-day MA. The shift is straightforward: move from a unilateral long bias above the 5-day MA to an inter-commodity spread strategy below it. This involves selling the near-month contract while buying a far-month contracts, aiming to profit from the convergence of the futures price spread over the next few months. This hedging/arbitrage strategy effectively mitigates sudden unilateral price spikes during consolidation below the 5-day MA. It also allows us to capture profits from spread convergence when the short squeeze phase ends.
The primary risk is ensuring both legs of the hedge can be executed and avoiding issues from expiring positions. Of course, once this arbitrage strategy yields a certain profit, we must be prepared to take timely profits or cut losses. Now, let's discuss the potential future volatility trend for silver.
The first reference dimension I choose is the trading distribution of CME futures options.
We know CME's gold and silver futures volumes are among the largest globally. Therefore, the trading distribution of its silver futures options can effectively reveal how institutional hot money is betting on silver's future direction.
Looking at the latest trading data from this Monday for silver futures options, compared to last Friday (December 26th), the put/call volume ratio saw a slight increase — from 0.63 a month ago, to 0.58 last Friday, and 0.66 yesterday. Although put volume grew, the overall options market sentiment isn't pessimistic and remains slightly bullish. Also, in terms of put trading, there was a significant increase in deep out-of-the-money (OTM) options volume, with very little volume for in-the-money (ITM) and at-the-money (ATM) options. For calls, ATM volume was low, while ITM and OTM volumes were similar.
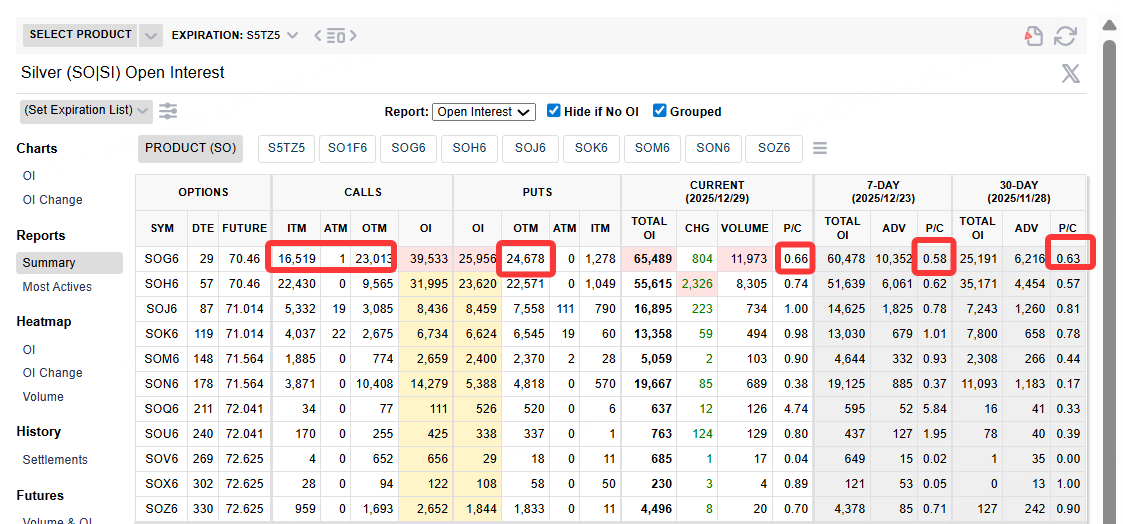
This indicates a broad distribution of deep OTM put options for silver futures. This likely represents selling deep OTM puts for protection or establishing speculative short positions in slightly OTM options. The even distribution of call option positions suggests no significant shift towards bearishness in yesterday's market . The OTM call volume is likely due to call writing, with many traders using calls to speculate on a potential top for silver futures.
Now, let's examine the top 15 futures options with the largest changes in trading volume.
This Monday, compared to last Friday, the largest increase in put option volume was for the SOH6 futures option contract (expiring in 57 days). This volume was concentrated in deep OTM put strikes: 60, 66, and 70. Based on the latest data, if these trades were primarily selling puts for protection, many traders believe the price levels of 60, 66, and 70 represent strong resistance over the next two months, with a high probability of a bounce from these levels.
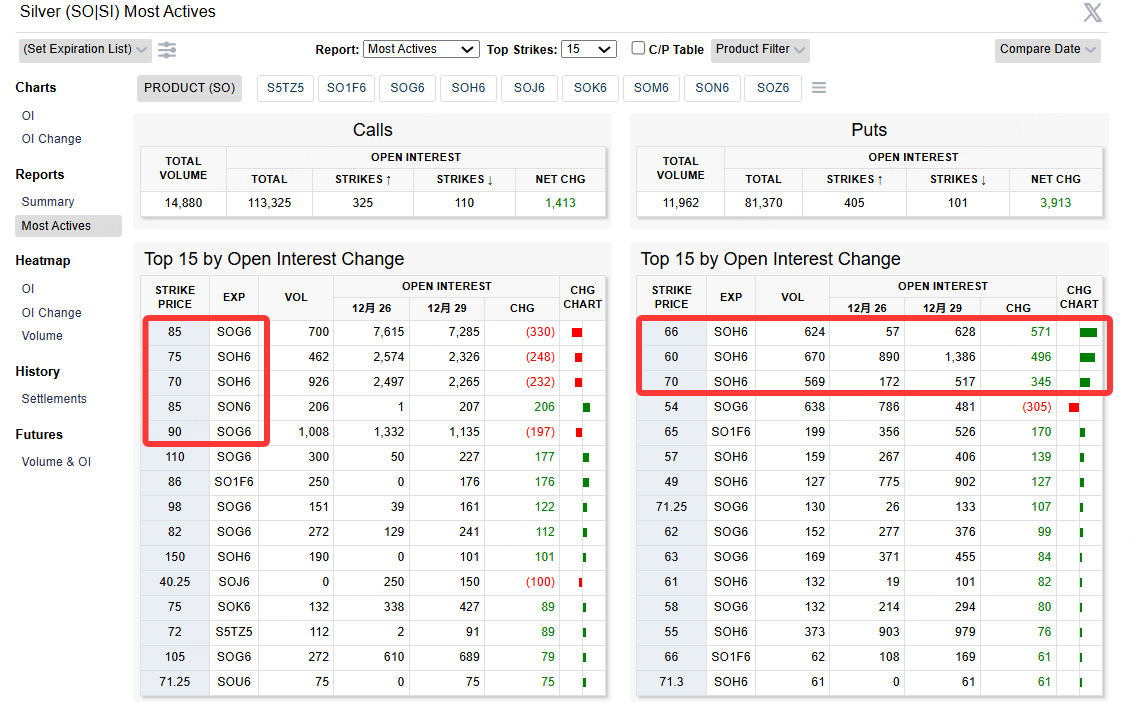
For call volume, the five futures option contracts with the largest open interest are one-month and two-month contracts (SOG6 and SOH6). The strike distribution is even: two ITM and three OTM, with OTM open interest significantly exceeding ITM. A reasonable assumption is that these OTM options represent traders' bets on potential upside ceilings, specifically at 90 and 85. Following Monday's flash crash, these sold call options saw interim profits being taken, reducing their open interest.
Visually, the futures options distribution looks like this:
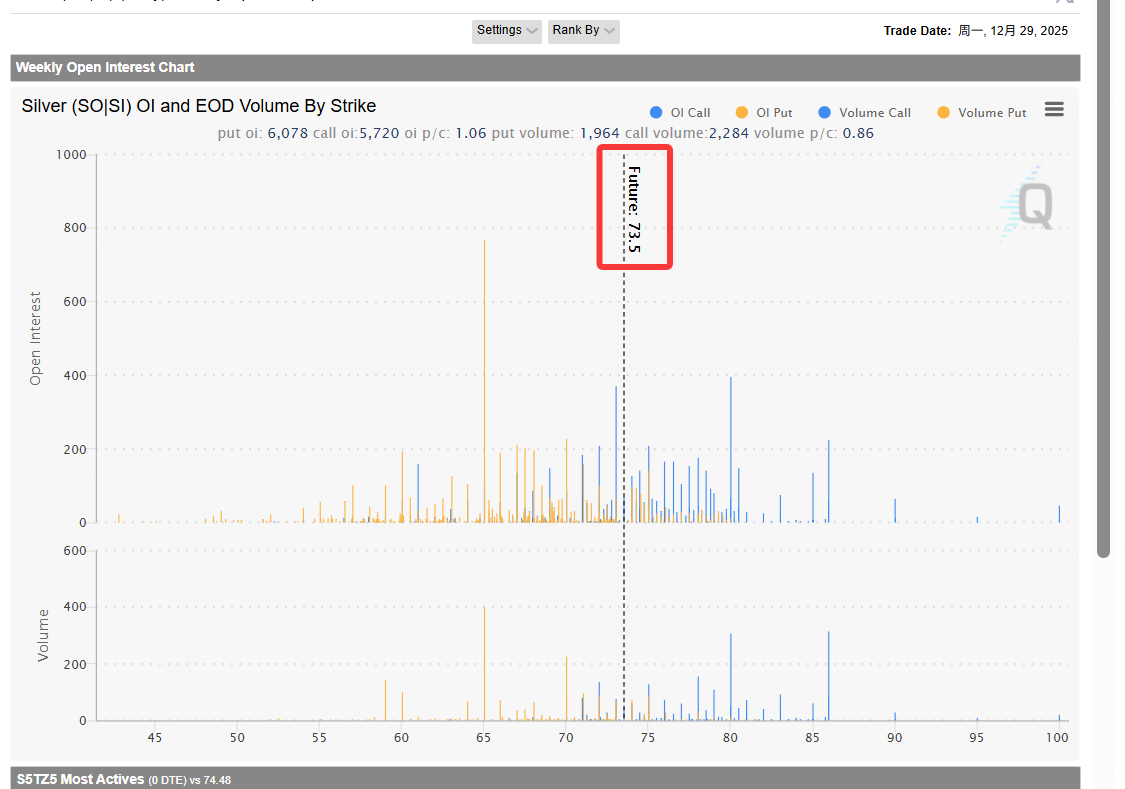
The dividing line is precisely at 73.5, which is the 5-day MA of the main continuous silver futures price.
Below this line, put volume increases, indicating stronger bearish sentiment. Above it, call volume increases, indicating stronger bullish sentiment. If we technically fit the bets placed by traders in the futures options market, silver's volatility range for the coming week might be between 60 and 85, with a small probability of spiking to 90. This is the estimated view derived from the futures options distribution chart.
Additionally, let's consider another dimension: the historical probability of silver's future performance under similar conditions.
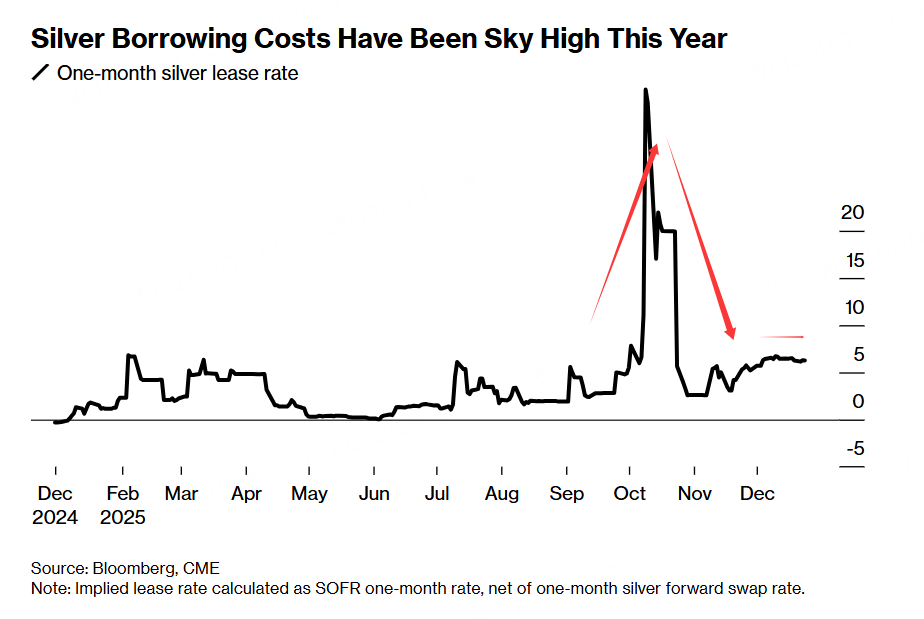
The previous short squeeze in silver wasn't due to extreme scarcity in inventories. The squeeze was largely driven by trader herd behavior following the collapse of the gold-silver ratio. Looking at the London Silver Lease Rate trend, physical silver isn't showing significant scarcity; the period of scarcity has passed.
Furthermore, the silver basis trend in China shows that domestic physical tightness is actually easing. Historical basis trends suggest China's silver futures basis may gradually weaken in the future.
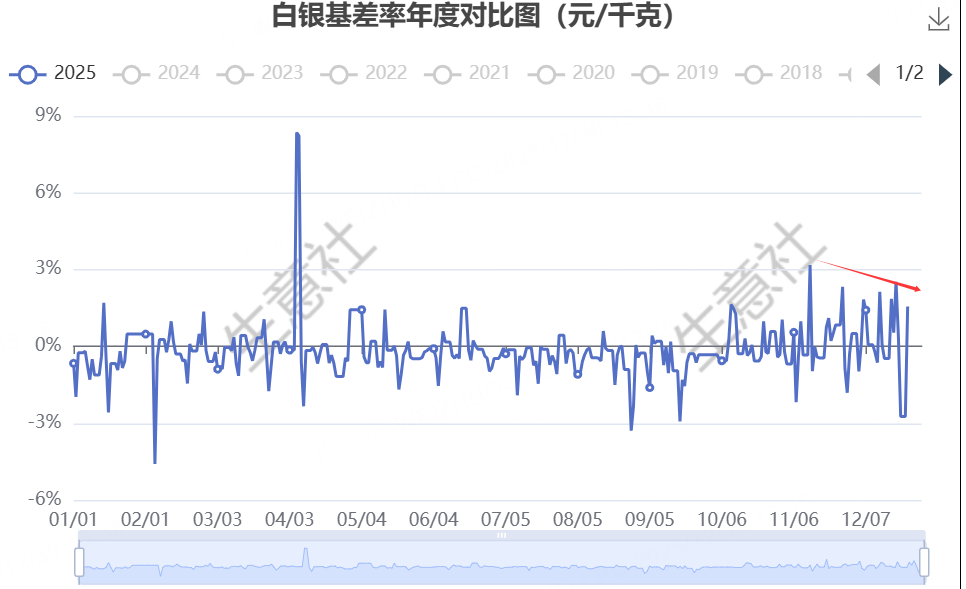
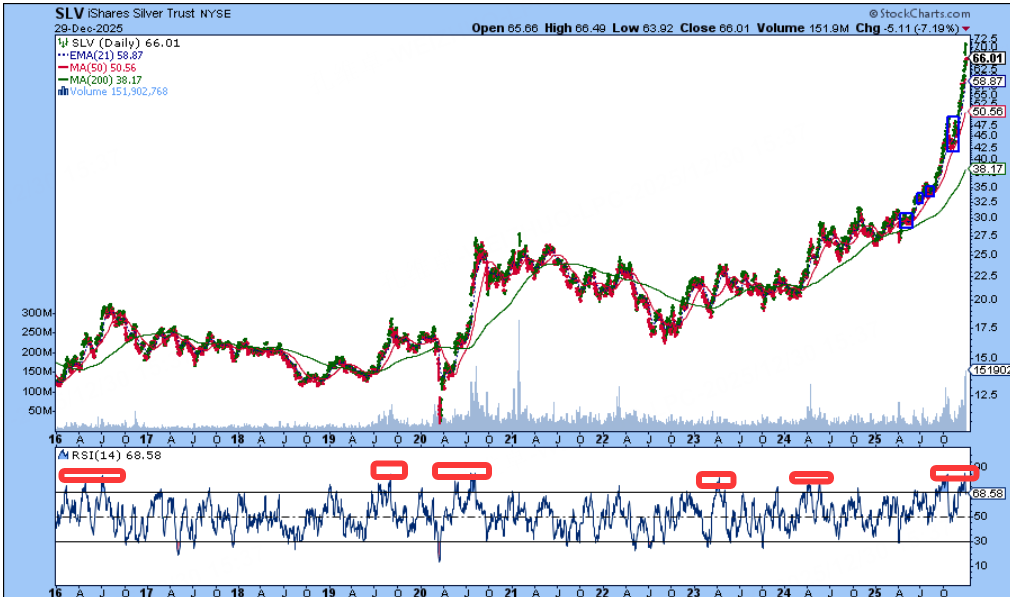
Therefore, this silver rally, detached from fundamentals, reflects a market squeeze/speculative behavior. Once reversed, the pullback tends to be sharp. We should also note that such squeeze-driven rallies don't typically end with a single flash crash. Observe that each time the 14-day RSI for silver futures surges above 70 and forms The peak of a stage, the market experiences significant volatility, but often followed by substantial rebounds.
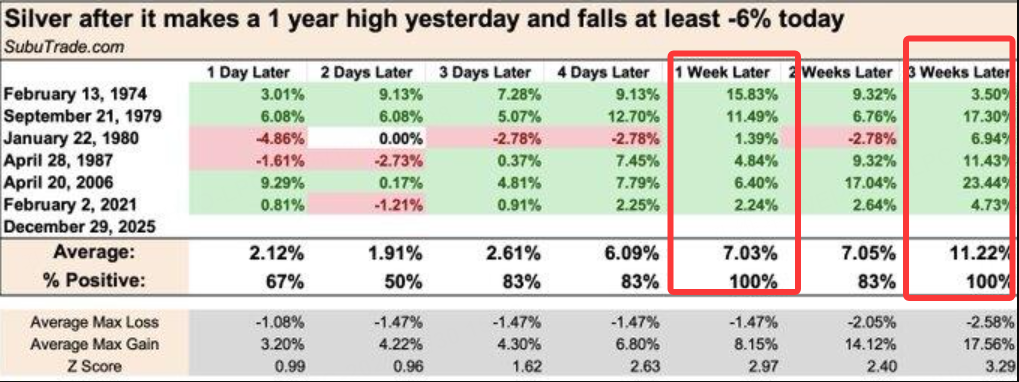
Let's review historical data backtesting. Looking at instances where silver futures surged to a 1-year high and then fell at least -6%, the probability of a rebound one week later is nearly 100%, with maximum returns exceeding 8 percentage points. However, note this conclusion is from a small sample pool, so its reference value is limited. The key takeaway is that the probability of a silver rebound one week later is relatively high.
Based on the above, we can establish a closed-loop logic for taking profits and cutting losses. Once silver breaks below the 5-day MA, we can sell the near-month futures contract and buy far-month contract for an inter-commodity spread. After one week, we observe whether silver's rebound has begun, taking profits timely. Using the 5-day MA as the dividing line, if silver surges back above it and holds for three consecutive trading days, we should shift back to a bullish stance, closing the short leg of our spread.
$E-mini S&P 500 - main 2603(ESmain)$ $Silver - main 2603(SImain)$ $Gold - main 2602(GCmain)$ $E-Micro Gold - main 2602(MGCmain)$ $Micro Silver Futures - main 2603(SILmain)$ $iShares Silver Trust(SLV)$
Disclaimer: Investing carries risk. This is not financial advice. The above content should not be regarded as an offer, recommendation, or solicitation on acquiring or disposing of any financial products, any associated discussions, comments, or posts by author or other users should not be considered as such either. It is solely for general information purpose only, which does not consider your own investment objectives, financial situations or needs. TTM assumes no responsibility or warranty for the accuracy and completeness of the information, investors should do their own research and may seek professional advice before investing.
- CyrilDavy·2025-12-30Silver's flash crash is brutal! Your MA strategy sounds solid, but I'd hold off pivoting until rebound signs. [看跌]1Report